Markets · 2 Min Read
KSE-100 Technical Breakdown: Is a Deeper Liquidity Sweep Underway?
"As the KSE-100 Traps Below Falling Trendlines, Here Are the Key Price Levels to Watch"
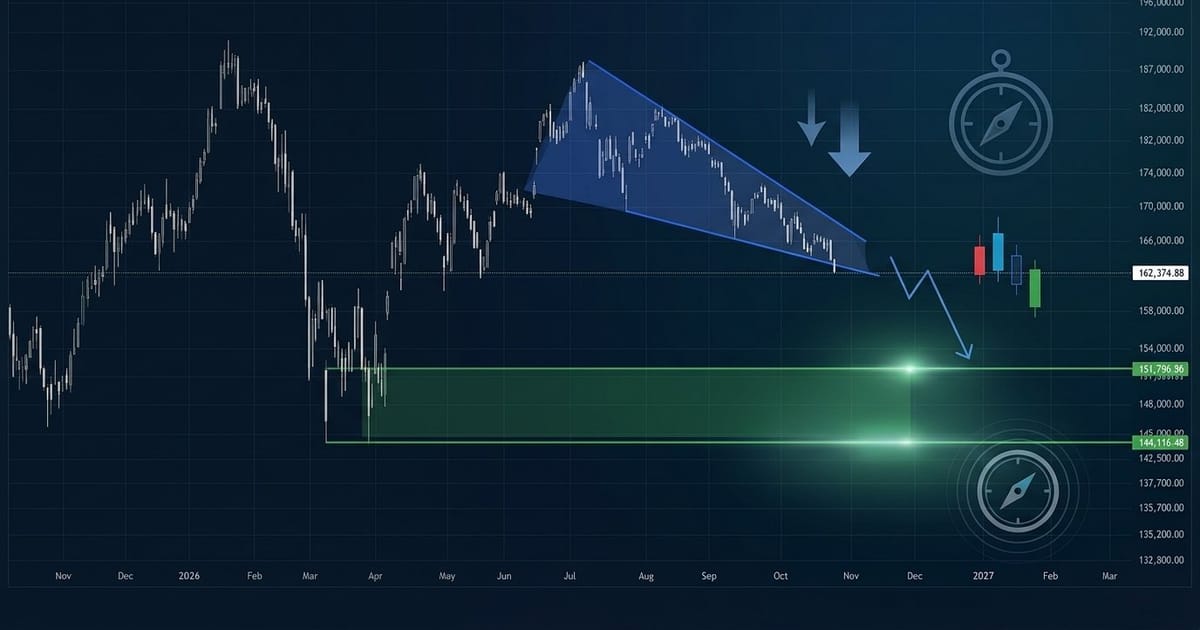
The KSE-100 Index continues to finding a prolonged corrective phase after peaking near historical highs earlier in the summer. Looking at the 1-Day TradingView Chart, the price action exhibits clear structural patterns, key liquidity zones,
Sign In To ReadNot investment advice. Advisors on Portfolio360 share their own views.